 在 TensorFlow.org 上查看 在 TensorFlow.org 上查看
|
 在 Google Colab 中运行 在 Google Colab 中运行
|
 在 GitHub 上查看源代码 在 GitHub 上查看源代码
|
 下载笔记本 下载笔记本
|
此笔记本重新实现并扩展了 pymc3 文档 中的贝叶斯“拐点分析”示例。
先决条件
import tensorflow.compat.v2 as tf
tf.enable_v2_behavior()
import tensorflow_probability as tfp
tfd = tfp.distributions
tfb = tfp.bijectors
import matplotlib.pyplot as plt
plt.rcParams['figure.figsize'] = (15,8)
%config InlineBackend.figure_format = 'retina'
import numpy as np
import pandas as pd
数据集
数据集来自 这里。请注意,此示例还有另一个版本 在其他地方,但它有“缺失”数据 - 在这种情况下,您需要插补缺失值。(否则,您的模型将永远不会离开其初始参数,因为似然函数将是未定义的。)
disaster_data = np.array([ 4, 5, 4, 0, 1, 4, 3, 4, 0, 6, 3, 3, 4, 0, 2, 6,
                           3, 3, 5, 4, 5, 3, 1, 4, 4, 1, 5, 5, 3, 4, 2, 5,
                           2, 2, 3, 4, 2, 1, 3, 2, 2, 1, 1, 1, 1, 3, 0, 0,
                           1, 0, 1, 1, 0, 0, 3, 1, 0, 3, 2, 2, 0, 1, 1, 1,
                           0, 1, 0, 1, 0, 0, 0, 2, 1, 0, 0, 0, 1, 1, 0, 2,
                           3, 3, 1, 1, 2, 1, 1, 1, 1, 2, 4, 2, 0, 0, 1, 4,
                           0, 0, 0, 1, 0, 0, 0, 0, 0, 1, 0, 0, 1, 0, 1])
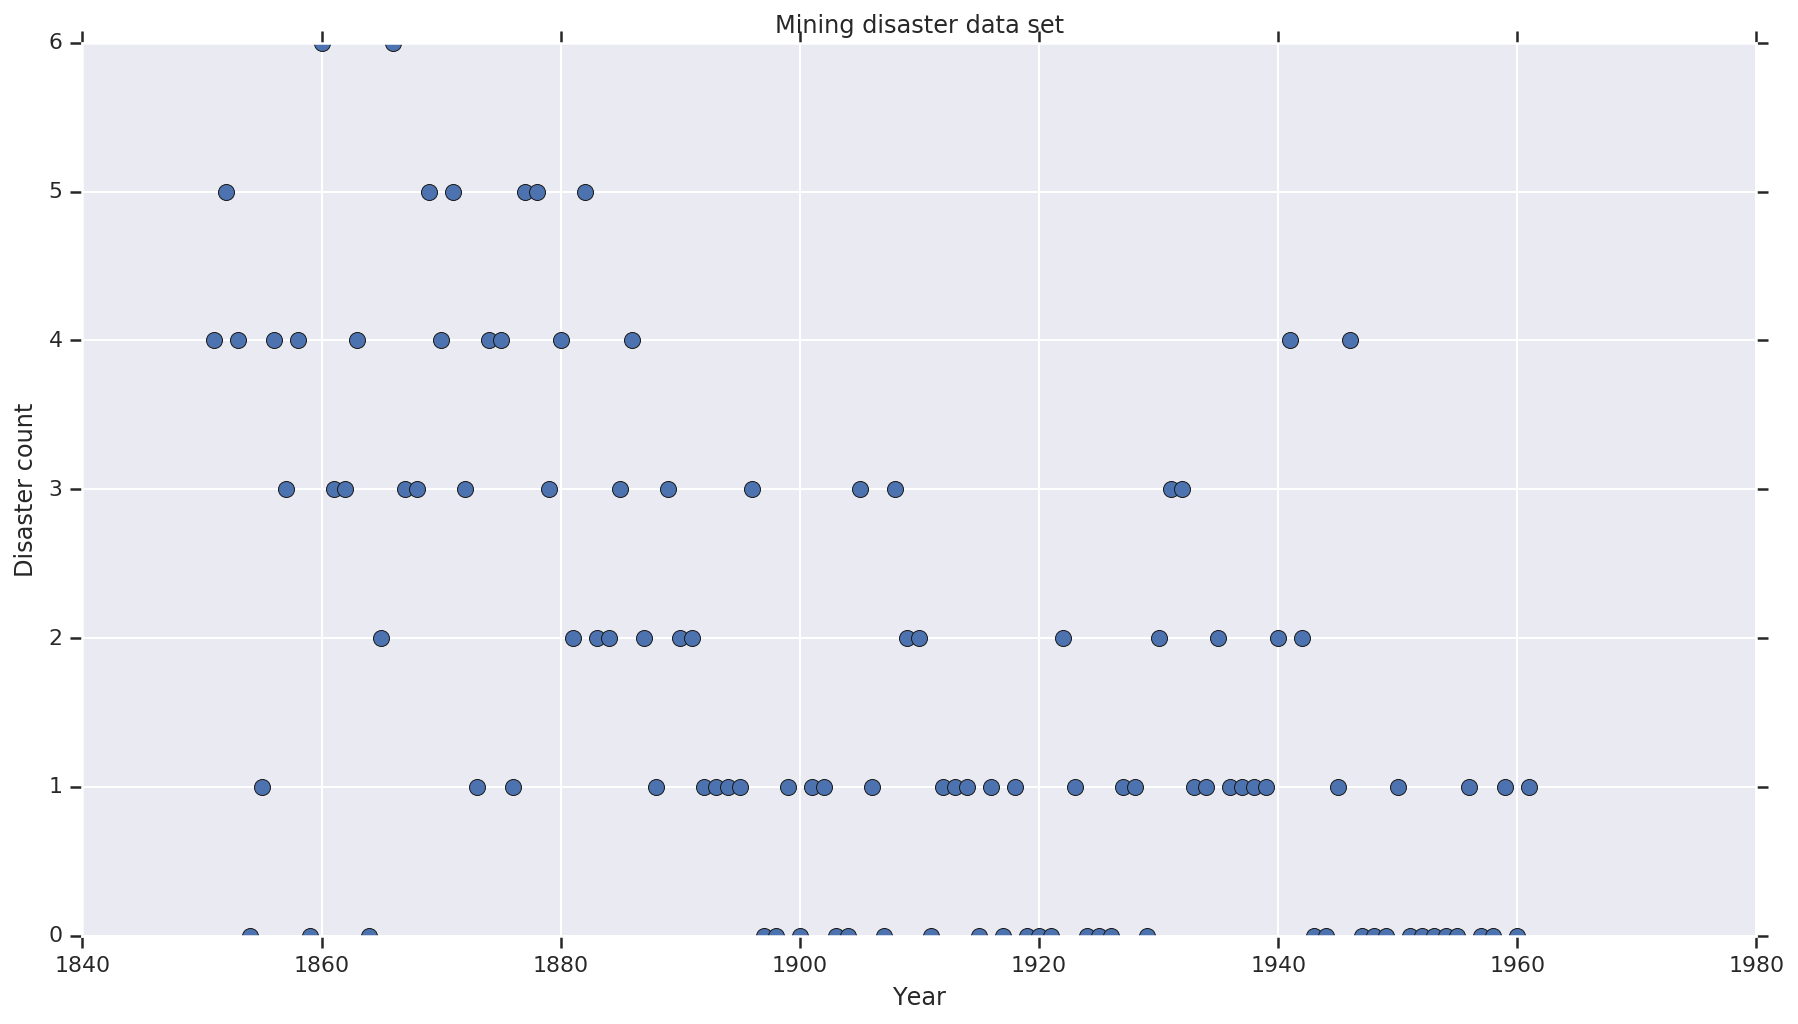
years = np.arange(1851, 1962)
plt.plot(years, disaster_data, 'o', markersize=8);
plt.ylabel('Disaster count')
plt.xlabel('Year')
plt.title('Mining disaster data set')
plt.show()

概率模型
该模型假设一个“拐点”(例如,安全法规发生变化的年份),以及在该拐点之前和之后具有恒定(但可能不同)速率的泊松分布的灾难率。
实际的灾难计数是固定的(观察到的);此模型的任何样本都需要指定拐点以及“早期”和“晚期”灾难率。
来自 pymc3 文档示例 的原始模型
\[ \begin{align*} (D_t|s,e,l)&\sim \text{Poisson}(r_t), \\ & \,\quad\text{with}\; r_t = \begin{cases}e & \text{if}\; t < s\\l &\text{if}\; t \ge s\end{cases} \\ s&\sim\text{Discrete Uniform}(t_l,\,t_h) \\ e&\sim\text{Exponential}(r_e)\\ l&\sim\text{Exponential}(r_l) \end{align*} \]
但是,平均灾难率 \(r_t\) 在拐点 \(s\) 处有一个不连续点,这使得它不可微。因此,它没有为哈密顿蒙特卡罗 (HMC) 算法提供梯度信号 - 但由于 \(s\) 先验是连续的,因此 HMC 回退到随机游走足以在此示例中找到高概率质量区域。
作为第二个模型,我们使用 sigmoid “开关” 在 e 和 l 之间修改原始模型,以使过渡可微,并使用连续均匀分布来表示拐点 \(s\)。(有人可能会争辩说,这个模型更符合现实,因为平均速率的“切换”可能会在几年内逐渐发生。)因此,新模型为
\[ \begin{align*} (D_t|s,e,l)&\sim\text{Poisson}(r_t), \\ & \,\quad \text{with}\; r_t = e + \frac{1}{1+\exp(s-t)}(l-e) \\ s&\sim\text{Uniform}(t_l,\,t_h) \\ e&\sim\text{Exponential}(r_e)\\ l&\sim\text{Exponential}(r_l) \end{align*} \]
在没有更多信息的情况下,我们假设 \(r_e = r_l = 1\) 作为先验的参数。我们将运行这两个模型并比较它们的推理结果。
def disaster_count_model(disaster_rate_fn):
  disaster_count = tfd.JointDistributionNamed(dict(
    e=tfd.Exponential(rate=1.),
    l=tfd.Exponential(rate=1.),
    s=tfd.Uniform(0., high=len(years)),
    d_t=lambda s, l, e: tfd.Independent(
        tfd.Poisson(rate=disaster_rate_fn(np.arange(len(years)), s, l, e)),
        reinterpreted_batch_ndims=1)
  ))
  return disaster_count

def disaster_rate_switch(ys, s, l, e):
  return tf.where(ys < s, e, l)

def disaster_rate_sigmoid(ys, s, l, e):
  return e + tf.sigmoid(ys - s) * (l - e)

model_switch = disaster_count_model(disaster_rate_switch)
model_sigmoid = disaster_count_model(disaster_rate_sigmoid)
上面的代码通过 JointDistributionSequential 分布定义了模型。 disaster_rate 函数使用 [0, ..., len(years)-1] 的数组调用,以生成一个长度为 len(years) 的随机变量向量 - 拐点之前的年份为 early_disaster_rate,之后的年份为 late_disaster_rate(对 sigmoid 过渡取模)。
这是一个目标对数概率函数是否合理的健全性检查
def target_log_prob_fn(model, s, e, l):
  return model.log_prob(s=s, e=e, l=l, d_t=disaster_data)

models = [model_switch, model_sigmoid]
print([target_log_prob_fn(m, 40., 3., .9).numpy() for m in models])  # Somewhat likely result
print([target_log_prob_fn(m, 60., 1., 5.).numpy() for m in models])  # Rather unlikely result
print([target_log_prob_fn(m, -10., 1., 1.).numpy() for m in models]) # Impossible result
[-176.94559, -176.28717]
[-371.3125, -366.8816]
[-inf, -inf]
HMC 进行贝叶斯推理
我们定义了所需的推理结果数量和 burn-in 步数;代码主要参考了 tfp.mcmc.HamiltonianMonteCarlo 的文档。它使用自适应步长(否则结果对所选步长值非常敏感)。我们使用 1 作为链的初始状态。
不过,这还不是全部故事。如果你回到上面的模型定义,你会注意到一些概率分布在整个实数线上没有定义。因此,我们通过用一个TransformedTransitionKernel包装 HMC 内核来限制 HMC 将要检查的空间,该内核指定了将实数转换为概率分布定义域的正向双射(参见下面代码中的注释)。
num_results = 10000
num_burnin_steps = 3000

@tf.function(autograph=False, jit_compile=True)
def make_chain(target_log_prob_fn):
   kernel = tfp.mcmc.TransformedTransitionKernel(
       inner_kernel=tfp.mcmc.HamiltonianMonteCarlo(
          target_log_prob_fn=target_log_prob_fn,
          step_size=0.05,
          num_leapfrog_steps=3),
       bijector=[
          # The switchpoint is constrained between zero and len(years).
          # Hence we supply a bijector that maps the real numbers (in a
          # differentiable way) to the interval (0;len(yers))
          tfb.Sigmoid(low=0., high=tf.cast(len(years), dtype=tf.float32)),
          # Early and late disaster rate: The exponential distribution is
          # defined on the positive real numbers
          tfb.Softplus(),
          tfb.Softplus(),
      ])
   kernel = tfp.mcmc.SimpleStepSizeAdaptation(
        inner_kernel=kernel,
        num_adaptation_steps=int(0.8*num_burnin_steps))

   states = tfp.mcmc.sample_chain(
      num_results=num_results,
      num_burnin_steps=num_burnin_steps,
      current_state=[
          # The three latent variables
          tf.ones([], name='init_switchpoint'),
          tf.ones([], name='init_early_disaster_rate'),
          tf.ones([], name='init_late_disaster_rate'),
      ],
      trace_fn=None,
      kernel=kernel)
   return states

switch_samples = [s.numpy() for s in make_chain(
    lambda *args: target_log_prob_fn(model_switch, *args))]
sigmoid_samples = [s.numpy() for s in make_chain(
    lambda *args: target_log_prob_fn(model_sigmoid, *args))]

switchpoint, early_disaster_rate, late_disaster_rate = zip(
    switch_samples, sigmoid_samples)
并行运行两个模型
可视化结果
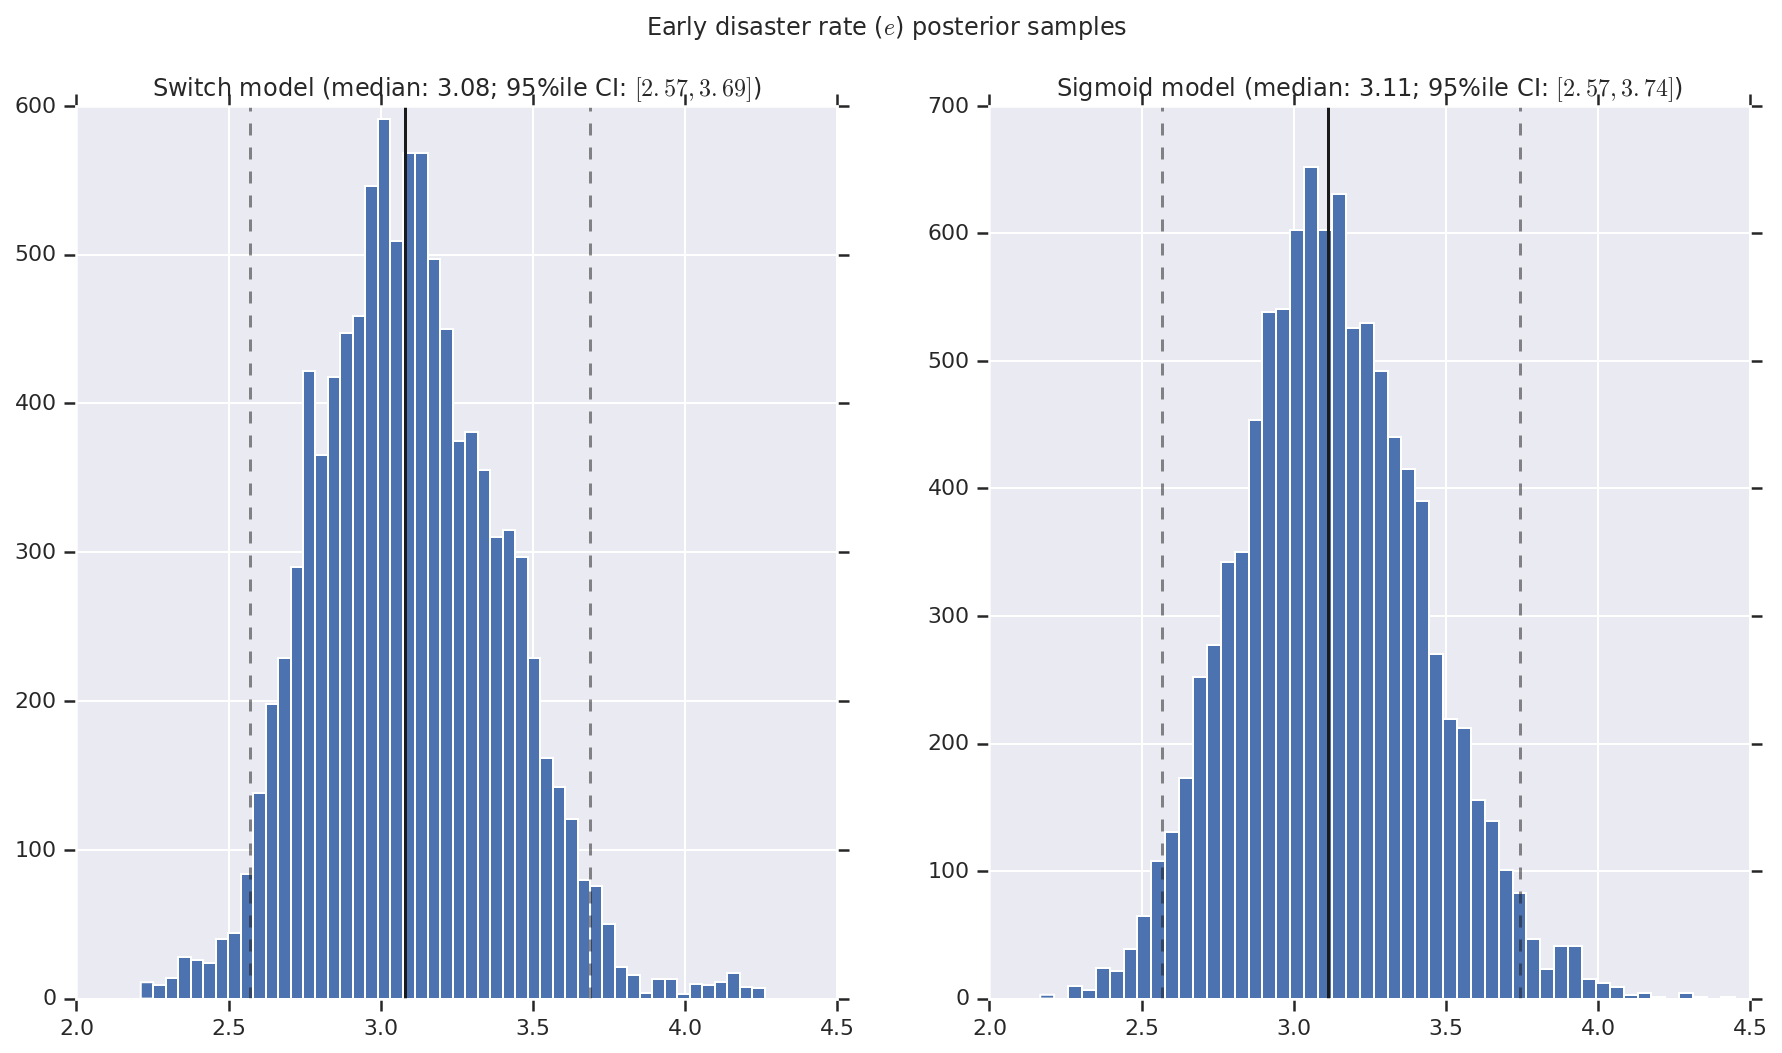
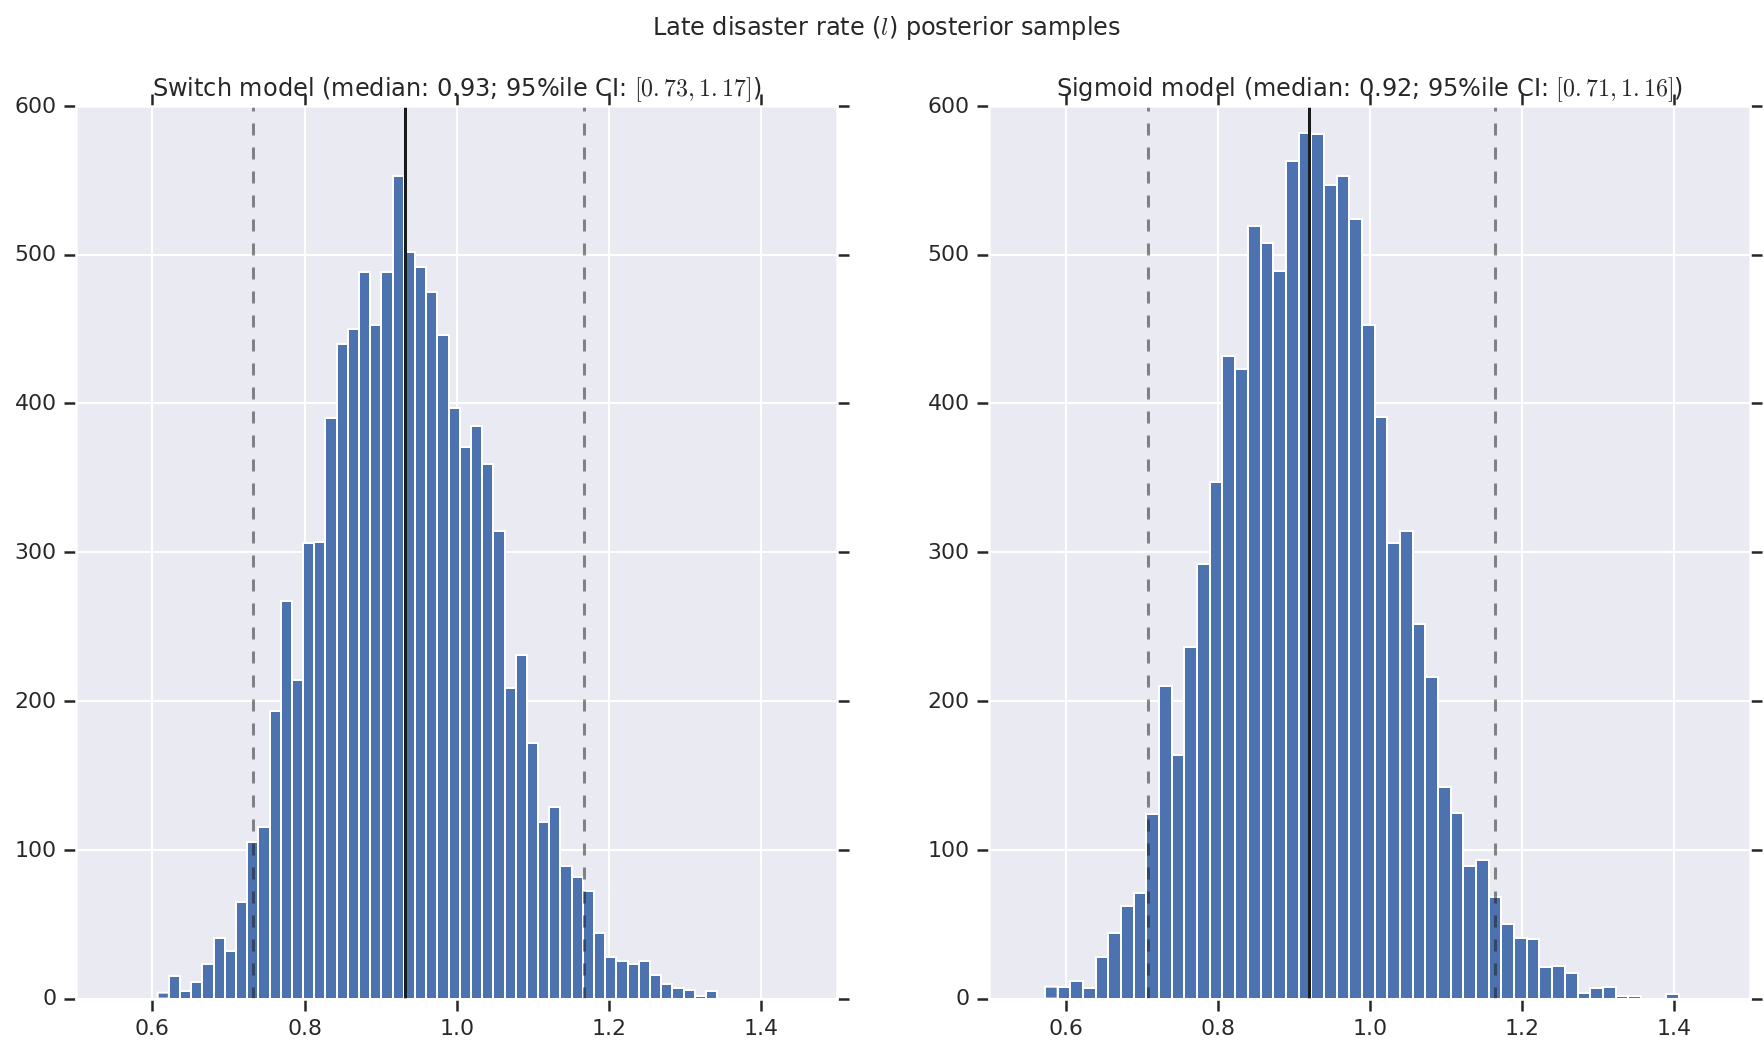
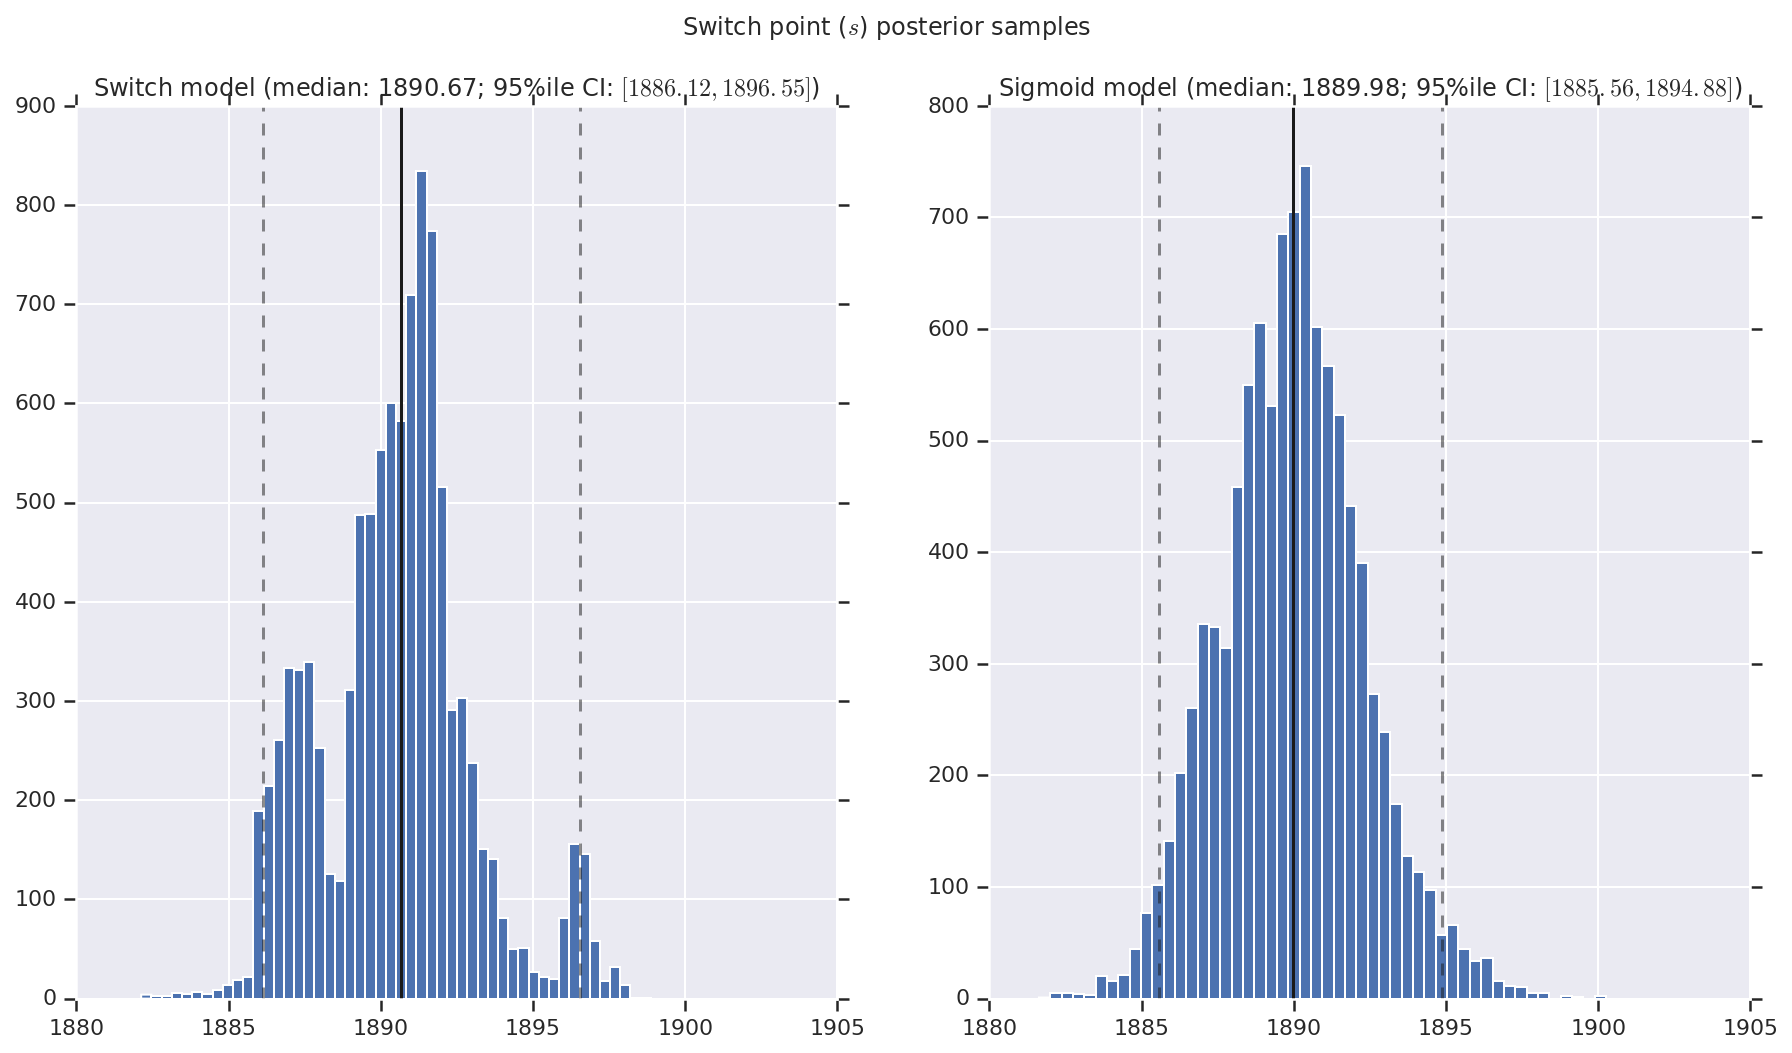
我们将结果可视化为早期和晚期灾难率以及切换点的后验分布样本的直方图。直方图上叠加了一条表示样本中位数的实线,以及作为虚线的 95% 可信区间边界。
def _desc(v):
  return '(median: {}; 95%ile CI: $[{}, {}]$)'.format(
      *np.round(np.percentile(v, [50, 2.5, 97.5]), 2))

for t, v in [
    ('Early disaster rate ($e$) posterior samples', early_disaster_rate),
    ('Late disaster rate ($l$) posterior samples', late_disaster_rate),
    ('Switch point ($s$) posterior samples', years[0] + switchpoint),
]:
  fig, ax = plt.subplots(nrows=1, ncols=2, sharex=True)
  for (m, i) in (('Switch', 0), ('Sigmoid', 1)):
    a = ax[i]
    a.hist(v[i], bins=50)
    a.axvline(x=np.percentile(v[i], 50), color='k')
    a.axvline(x=np.percentile(v[i], 2.5), color='k', ls='dashed', alpha=.5)
    a.axvline(x=np.percentile(v[i], 97.5), color='k', ls='dashed', alpha=.5)
    a.set_title(m + ' model ' + _desc(v[i]))
  fig.suptitle(t)
  plt.show()


