 在 TensorFlow.org 上查看 在 TensorFlow.org 上查看
|
 在 Google Colab 中运行 在 Google Colab 中运行
|
 在 GitHub 上查看 在 GitHub 上查看
|
 下载笔记本 下载笔记本
|
简介
该 初学者教程 演示了如何使用 TensorFlow 的决策森林准备数据、训练和评估(随机森林、梯度提升树和 CART)分类器和回归器。(我们将 TensorFlow 决策森林缩写为 *TF-DF*。)您还学习了如何使用内置的 plot_model_in_colab() 函数可视化树,以及如何显示特征重要性度量。
本教程的目标是深入研究通过可视化来解释分类器和回归器决策树。我们将查看详细的树结构图,以及决策树如何划分特征空间以做出决策的描述。树结构图有助于我们了解模型的行为,而特征空间图有助于我们通过显示特征和目标变量之间的关系来了解数据。
我们将使用的可视化库称为 dtreeviz,为了保持一致性,我们将重复使用初学者教程中的企鹅和鲍鱼数据。(要了解有关 dtreeviz 和决策树可视化的更多信息,请参阅 YouTube 视频 或有关 dtreeviz 设计 的文章)。
在本教程中,您将学习如何
- 显示来自 TF-DF 森林的决策树的结构
- 更改 dtreeviz 树结构图的大小和样式
- 绘制叶信息,例如每个叶的实例数、每个叶的目标值分布以及有关叶的各种统计信息
- 跟踪树对特定实例的解释,并显示从根到做出预测的叶的路径
- 打印树如何解释实例的英文解释
- 查看一维和二维特征空间,以查看模型如何将它们划分为类似实例的区域
设置
安装 TF-DF 和 dtreeviz
pip install -q -U tensorflow_decision_forests
pip install -q -U dtreeviz
导入库
import tensorflow_decision_forests as tfdf

import tensorflow as tf

import os
import numpy as np
import pandas as pd
import tensorflow as tf
import math

import dtreeviz

from matplotlib import pyplot as plt
from IPython import display

# avoid "Arial font not found warnings"
import logging
logging.getLogger('matplotlib.font_manager').setLevel(level=logging.CRITICAL)

display.set_matplotlib_formats('retina') # generate hires plots

np.random.seed(1234)  # reproducible plots/data for explanatory reasons
/tmpfs/tmp/ipykernel_61816/31193553.py:20: DeprecationWarning: `set_matplotlib_formats` is deprecated since IPython 7.23, directly use `matplotlib_inline.backend_inline.set_matplotlib_formats()`
# Let's check the versions:
tfdf.__version__, dtreeviz.__version__  # want dtreeviz >= 2.2.0
('1.9.0', '2.2.2')
有一个函数将数据集拆分为训练集和测试集会很方便,所以让我们定义一个
def split_dataset(dataset, test_ratio=0.30, seed=1234):
  """
  Splits a panda dataframe in two, usually for train/test sets.
  Using the same random seed ensures we get the same split so
  that the description in this tutorial line up with generated images.
  """
  np.random.seed(seed)
  test_indices = np.random.rand(len(dataset)) < test_ratio
  return dataset[~test_indices], dataset[test_indices]
可视化分类器树
 使用企鹅数据,让我们构建一个分类器来预测
 species (Adelie、Gentoo 或 Chinstrap) 来自其他 7 列。然后,我们可以使用 dtreeviz 显示树并询问模型以了解有关它如何做出决策的更多信息,以及了解有关数据的更多信息。
加载、清理和准备数据
就像我们在初学者教程中所做的那样,让我们从下载企鹅数据并将其放入 pandas 数据框开始。
# Download the Penguins dataset
!wget -q https://storage.googleapis.com/download.tensorflow.org/data/palmer_penguins/penguins.csv -O /tmp/penguins.csv

# Load a dataset into a Pandas Dataframe.
df_penguins = pd.read_csv("/tmp/penguins.csv")
df_penguins.head(3)
快速检查表明数据集中存在缺失值
df_penguins.columns[df_penguins.isna().any()].tolist()
['bill_length_mm', 'bill_depth_mm', 'flipper_length_mm', 'body_mass_g', 'sex']
与其插补缺失值,不如直接删除不完整的行,以便在本教程中专注于可视化
df_penguins = df_penguins.dropna() # E.g., 19 rows have missing sex etc...
TF-DF 要求分类标签为 [0, num_labels) 中的整数,所以让我们将标签列 species 从字符串转换为整数。
penguin_label = "species"   # Name of the classification target label
classes = list(df_penguins[penguin_label].unique())
df_penguins[penguin_label] = df_penguins[penguin_label].map(classes.index)

print(f"Target '{penguin_label}'' classes: {classes}")
df_penguins.head(3)
Target 'species'' classes: ['Adelie', 'Gentoo', 'Chinstrap']
现在,让我们使用上面定义的便利函数获得 70-30 的训练和测试拆分,然后将这些数据框转换为 TensorFlow 数据集。
拆分训练/测试集并训练模型
# Split into training and test sets
train_ds_pd, test_ds_pd = split_dataset(df_penguins)
print(f"{len(train_ds_pd)} examples in training, {len(test_ds_pd)} examples for testing.")

# Convert to tensorflow data sets
train_ds = tfdf.keras.pd_dataframe_to_tf_dataset(train_ds_pd, label=penguin_label)
test_ds = tfdf.keras.pd_dataframe_to_tf_dataset(test_ds_pd, label=penguin_label)
243 examples in training, 90 examples for testing.
训练随机森林分类器
# Train a Random Forest model
cmodel = tfdf.keras.RandomForestModel(verbose=0, random_seed=1234)
cmodel.fit(train_ds)
[INFO 24-04-20 11:36:03.3354 UTC kernel.cc:1233] Loading model from path /tmpfs/tmp/tmp_53_u4ze/model/ with prefix becfdeef7e31483f
[INFO 24-04-20 11:36:03.3489 UTC decision_forest.cc:734] Model loaded with 300 root(s), 4310 node(s), and 7 input feature(s).
[INFO 24-04-20 11:36:03.3489 UTC abstract_model.cc:1344] Engine "RandomForestGeneric" built
[INFO 24-04-20 11:36:03.3490 UTC kernel.cc:1061] Use fast generic engine
<tf_keras.src.callbacks.History at 0x7fca787a2e80>
为了验证一切正常,让我们检查模型的准确率,它应该约为 99%
cmodel.compile(metrics=["accuracy"])
cmodel.evaluate(test_ds, return_dict=True, verbose=0)
{'loss': 0.0, 'accuracy': 0.9888888597488403}
是的,模型在测试集上是准确的。
显示决策树
现在我们有了模型,让我们从随机森林中选择其中一棵树,看看它的结构。dtreeviz 库要求我们将 TF-DF 模型与相关训练数据捆绑在一起,然后它可以使用这些数据来反复询问模型。
# Tell dtreeviz about training data and model
penguin_features = [f.name for f in cmodel.make_inspector().features()]
viz_cmodel = dtreeviz.model(cmodel,
                           tree_index=3,
                           X_train=train_ds_pd[penguin_features],
                           y_train=train_ds_pd[penguin_label],
                           feature_names=penguin_features,
                           target_name=penguin_label,
                           class_names=classes)
最常见的 dtreeviz API 函数是 view(),它显示树的结构以及与每个决策节点关联的实例的特征分布。
viz_cmodel.view(scale=1.2)
决策树的根节点表明,分类首先通过测试 flipper_length_mm 特征,其分割值为 206 来开始。如果测试实例的 flipper_length_mm 特征值小于 206,则决策树向下遍历左子节点。如果它大于或等于 206,则分类通过向下遍历右子节点进行。
为了了解模型为什么选择在 flipper_length_mm=206 处分割训练数据,让我们放大根节点。
viz_cmodel.view(depth_range_to_display=[0,0], scale=1.5)
对于人类来说,很明显,206 右侧几乎所有实例都是蓝色的(Gentoo 企鹅)。因此,通过单个特征比较,模型可以将训练数据分割成一个相当纯净的 Gentoo 组和一个混合组。(模型将在根节点以下的未来分割中进一步提纯子组。)
决策树还有一个分类决策节点,它可以测试类别子集,而不是简单的数值分割。例如,让我们看一下树的第二层。
viz_cmodel.view(depth_range_to_display=[1,1], scale=1.5)
该节点(左侧)测试特征 island,如果测试实例具有 island==Dream,则分类向下遍历其右子节点。对于另外两个类别,Torgersen 和 Biscoe,分类向下遍历其左子节点。(此图中右侧的 bill_length_mm 节点与关于分类决策节点的讨论无关。)
这种分割行为突出了决策树将特征空间划分为具有提高目标值纯度目标的区域。我们将在下面更详细地研究特征空间。
决策树可能变得非常大,并且并非总是需要完整地绘制它们。但是,我们可以查看树的简化版本、树的一部分、各个叶节点中的训练实例数量(在其中进行预测)等等。以下是一个示例,其中我们关闭了精美的决策节点分布图,并将整个图像缩放到 75%。
viz_cmodel.view(fancy=False, scale=.75)
我们还可以使用从左到右的方向,这有时会导致更小的图。
viz_cmodel.view(orientation='LR', scale=.75)
如果您不喜欢饼图,您也可以获得条形图。
viz_cmodel.view(leaftype='barh', scale=.75)
检查叶节点统计信息
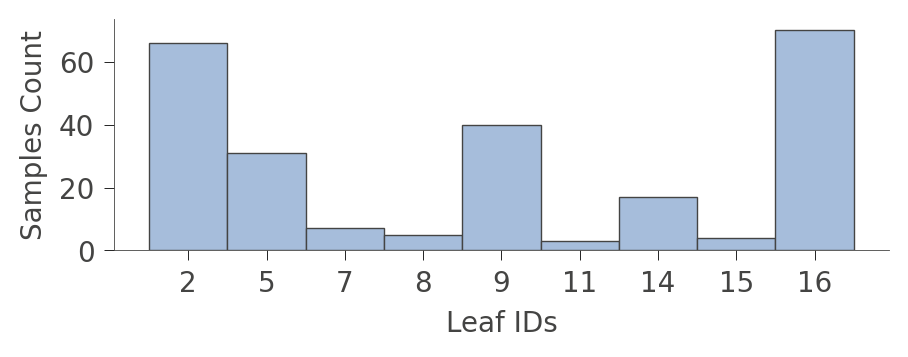
决策树在叶节点处做出决策,因此有时放大这些节点很有用,尤其是在整个图太大而无法一次看到所有内容时。以下是如何检查分组到每个叶节点中的训练数据实例数量。
viz_cmodel.leaf_sizes(figsize=(5,1.5))
一个可能更有趣的图是显示各个叶节点中每种训练实例的比例的图。训练的目标是让叶节点具有单一颜色,因为它代表“纯净”节点,可以高置信度地预测该类别。
viz_cmodel.ctree_leaf_distributions(figsize=(5,1.5))

我们还可以放大特定叶节点以查看各个实例特征的一些统计信息。例如,叶节点 5 包含 31 个实例,其中 24 个具有唯一的 bill_length_mm 值。
viz_cmodel.node_stats(node_id=5)
决策树如何对实例进行分类
现在我们已经了解了决策树的结构和内容,让我们弄清楚分类器如何对特定实例做出决策。通过将实例(特征向量)作为参数 x 传入,view() 函数将突出显示分类器为该实例做出预测所遵循的从根节点到叶节点的路径。
x = train_ds_pd[penguin_features].iloc[20]
viz_cmodel.view(x=x, scale=.75)
/tmpfs/src/tf_docs_env/lib/python3.9/site-packages/dtreeviz/models/shadow_decision_tree.py:335: FutureWarning: Series.__getitem__ treating keys as positions is deprecated. In a future version, integer keys will always be treated as labels (consistent with DataFrame behavior). To access a value by position, use `ser.iloc[pos]`
/tmpfs/src/tf_docs_env/lib/python3.9/site-packages/dtreeviz/trees.py:1231: FutureWarning: Series.__getitem__ treating keys as positions is deprecated. In a future version, integer keys will always be treated as labels (consistent with DataFrame behavior). To access a value by position, use `ser.iloc[pos]`
/tmpfs/src/tf_docs_env/lib/python3.9/site-packages/dtreeviz/trees.py:1225: FutureWarning: Series.__getitem__ treating keys as positions is deprecated. In a future version, integer keys will always be treated as labels (consistent with DataFrame behavior). To access a value by position, use `ser.iloc[pos]`
/tmpfs/src/tf_docs_env/lib/python3.9/site-packages/dtreeviz/models/shadow_decision_tree.py:335: FutureWarning: Series.__getitem__ treating keys as positions is deprecated. In a future version, integer keys will always be treated as labels (consistent with DataFrame behavior). To access a value by position, use `ser.iloc[pos]`
该图突出显示了树路径以及测试的实例特征(island、bill_length_mm 和 flipper_length_mm)。
对于非常大的树,您还可以要求仅查看树中的路径,而不是整个树,方法是使用 show_just_path 参数。
viz_cmodel.view(x=x, show_just_path=True, scale=.75)
/tmpfs/src/tf_docs_env/lib/python3.9/site-packages/dtreeviz/models/shadow_decision_tree.py:335: FutureWarning: Series.__getitem__ treating keys as positions is deprecated. In a future version, integer keys will always be treated as labels (consistent with DataFrame behavior). To access a value by position, use `ser.iloc[pos]`
/tmpfs/src/tf_docs_env/lib/python3.9/site-packages/dtreeviz/trees.py:1231: FutureWarning: Series.__getitem__ treating keys as positions is deprecated. In a future version, integer keys will always be treated as labels (consistent with DataFrame behavior). To access a value by position, use `ser.iloc[pos]`
/tmpfs/src/tf_docs_env/lib/python3.9/site-packages/dtreeviz/trees.py:1225: FutureWarning: Series.__getitem__ treating keys as positions is deprecated. In a future version, integer keys will always be treated as labels (consistent with DataFrame behavior). To access a value by position, use `ser.iloc[pos]`
/tmpfs/src/tf_docs_env/lib/python3.9/site-packages/dtreeviz/models/shadow_decision_tree.py:335: FutureWarning: Series.__getitem__ treating keys as positions is deprecated. In a future version, integer keys will always be treated as labels (consistent with DataFrame behavior). To access a value by position, use `ser.iloc[pos]`
要获取对实例分类的英文解释,即最小的可能表示,请使用 explain_prediction_path()。
print(viz_cmodel.explain_prediction_path(x=x))
bill_length_mm < 40.6
flipper_length_mm < 206.0
island in {'Dream'}
/tmpfs/src/tf_docs_env/lib/python3.9/site-packages/dtreeviz/models/shadow_decision_tree.py:335: FutureWarning: Series.__getitem__ treating keys as positions is deprecated. In a future version, integer keys will always be treated as labels (consistent with DataFrame behavior). To access a value by position, use `ser.iloc[pos]`
/tmpfs/src/tf_docs_env/lib/python3.9/site-packages/dtreeviz/interpretation.py:54: FutureWarning: Series.__getitem__ treating keys as positions is deprecated. In a future version, integer keys will always be treated as labels (consistent with DataFrame behavior). To access a value by position, use `ser.iloc[pos]`
模型测试 x 的 bill_length_mm、flipper_length_mm 和 island 特征以到达叶节点,在本例中,它预测 Adelie。
特征空间划分
到目前为止,我们已经了解了树的结构以及树如何解释实例以做出决策,但决策节点到底在做什么?决策树将特征空间划分为具有相似目标值的观测组。每个叶节点都代表从根节点向下到该叶节点执行的特征分割序列所产生的划分。对于分类,目标是让分区共享相同或几乎相同的目标类别值。
如果我们回顾树结构,我们会看到变量 flipper_length_mm 在树中由三个节点测试。相应的决策节点分割值为 189、206 和 210.5,这意味着决策树将 flipper_length_mm 分割成四个区域,我们可以使用 ctree_feature_space() 来说明这一点。
viz_cmodel.ctree_feature_space(features=['flipper_length_mm'], show={'splits','legend'}, figsize=(5,1.5))

(在此单特征情况下,纵轴没有意义。为了提高可见度,该纵轴只是将代表不同目标类别的点分离到不同的高度,并添加了一些噪声。)
在 206 处的第一个分割(在根节点处测试)将训练数据分离成 Adelie/Gentoo 企鹅的重叠区域和一个相当纯净的 Chinstrap 企鹅区域。随后的 210.5 分割进一步隔离了一个纯 Chinstrap 区域(鳍长超过 210.5)。决策树还在 189 处分割,但产生的区域仍然不纯净。树依赖于通过其他变量进行分割来分离 Adelie/Gentoo 企鹅的“混淆”团块。因为我们传入了一个特征名称,所以没有显示其他特征的分割。
让我们看一下另一个具有更多分割的特征,bill_length_mm。决策树中有四个节点测试该特征,因此我们得到了一个特征空间,它被分割成五个区域。请注意,模型如何通过测试 bill_length_mm 小于 40 来分离出一个纯净的 Adelie 区域。
viz_cmodel.ctree_feature_space(features=['bill_length_mm'], show={'splits','legend'},
                               figsize=(5,1.5))

我们还可以检查树如何对两个特征同时进行特征空间划分,例如 flipper_length_mm 和 bill_length_mm。
viz_cmodel.ctree_feature_space(features=['flipper_length_mm','bill_length_mm'],
                               show={'splits','legend'}, figsize=(5,5))
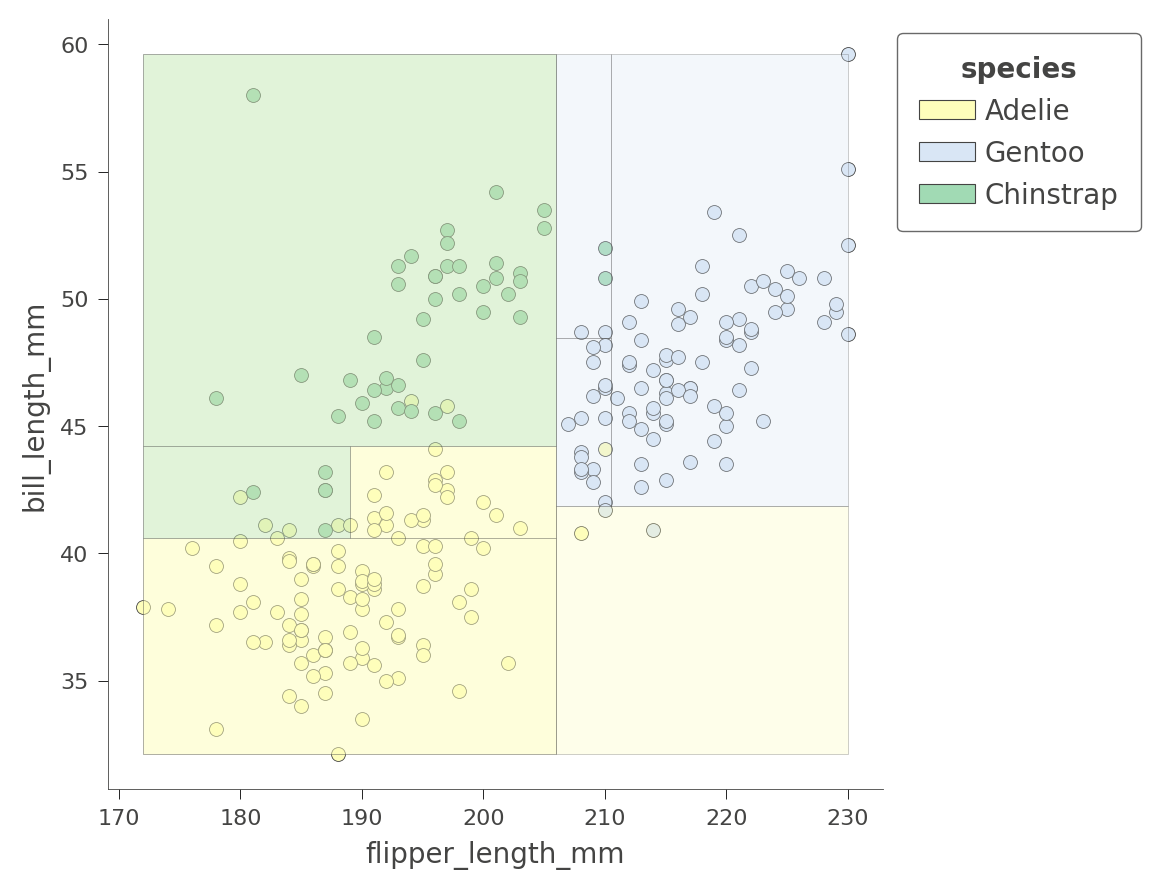
区域的颜色表示特征落在该区域中的测试实例的分类颜色。
通过同时考虑两个变量,决策树可以创建更纯净(矩形)的区域,从而导致更准确的预测。例如,左上角区域完全包含 Chinstrap 企鹅。
根据我们选择的变量,区域将或多或少地纯净。以下是在 bill_depth_mm 和 bill_length_mm 特征上进行的另一个二维特征空间划分,其中阴影表示不确定性。
viz_cmodel.ctree_feature_space(features=['body_mass_g','bill_length_mm'],
                               show={'splits','legend'}, figsize=(5,5))
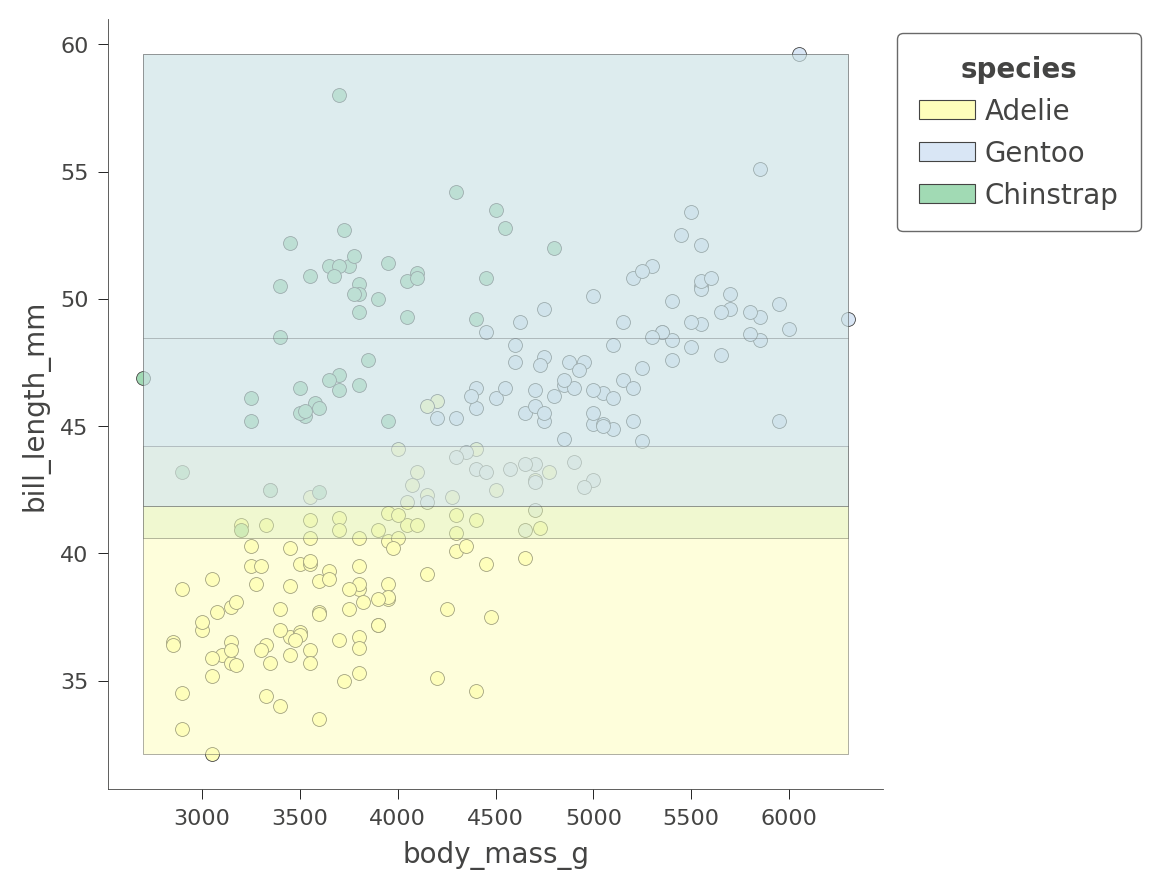
只有 Adelie 区域相当纯净。树依赖于其他变量来获得更好的划分,正如我们刚刚在 flipper_length_mm 与 bill_length_mm 空间中看到的那样。
dtreeviz 库目前无法可视化超过两个特征维度的分类。
此时,您已经很好地了解了如何可视化决策树的结构、树如何划分特征空间以及树如何对测试实例进行分类。现在让我们转向回归,看看 dtreeviz 如何可视化回归树。
可视化回归树
 让我们使用初学者教程中使用的 鲍鱼数据集 来探索回归树的结构。正如我们在上面的分类中所做的那样,我们首先加载和准备用于训练的数据。给定 8 个变量,我们希望预测鲍鱼壳中的环数。
加载、清理和准备数据
使用以下代码片段,我们可以看到除了 Type(性别)变量之外,所有特征都是数值型的。
# Download the dataset.
!wget -q https://storage.googleapis.com/download.tensorflow.org/data/abalone_raw.csv -O /tmp/abalone.csv

df_abalone = pd.read_csv("/tmp/abalone.csv")
df_abalone.head(3)
幸运的是,没有缺失数据需要处理。
df_abalone.isna().any()
Type             False
LongestShell     False
Diameter         False
Height           False
WholeWeight      False
ShuckedWeight    False
VisceraWeight    False
ShellWeight      False
Rings            False
dtype: bool
拆分训练/测试集并训练模型
abalone_label = "Rings"   # Name of the classification target label

# Split into training and test sets 70/30
df_train_abalone, df_test_abalone = split_dataset(df_abalone)
print(f"{len(df_train_abalone)} examples in training, {len(df_test_abalone)} examples for testing.")

# Convert to tensorflow data sets
train_ds = tfdf.keras.pd_dataframe_to_tf_dataset(df_train_abalone, label=abalone_label, task=tfdf.keras.Task.REGRESSION)
test_ds = tfdf.keras.pd_dataframe_to_tf_dataset(df_test_abalone, label=abalone_label, task=tfdf.keras.Task.REGRESSION)
2935 examples in training, 1242 examples for testing.
训练随机森林回归器
现在我们有了训练集和测试集,让我们训练一个随机森林回归器。由于数据的性质,我们需要人为地限制树的高度才能将其可视化。(限制树深度也是一种正则化形式,可以防止过拟合。)最大深度为 5 足够深,可以相当准确,但足够小,可以可视化。
rmodel = tfdf.keras.RandomForestModel(task=tfdf.keras.Task.REGRESSION,
                                      max_depth=5,      # don't let the tree get too big
                                      random_seed=1234, # create same tree every time
                                      verbose=0)
rmodel.fit(x=train_ds)
[INFO 24-04-20 11:36:22.3119 UTC kernel.cc:1233] Loading model from path /tmpfs/tmp/tmpa_ykq0gz/model/ with prefix ba97bae0bd574ab0
[INFO 24-04-20 11:36:22.3376 UTC decision_forest.cc:734] Model loaded with 300 root(s), 9264 node(s), and 8 input feature(s).
[INFO 24-04-20 11:36:22.3376 UTC abstract_model.cc:1344] Engine "RandomForestOptPred" built
[INFO 24-04-20 11:36:22.3376 UTC kernel.cc:1061] Use fast generic engine
<tf_keras.src.callbacks.History at 0x7fca78ee7ee0>
让我们使用 MAE 和 MSE 检查模型的准确性。Rings 的范围是 1-27,因此测试集上的 MAE 为 1.66 并不理想,但对于我们的演示目的来说是可以接受的。
# Evaluate the model on the test dataset.
rmodel.compile(metrics=["mae","mse"])
evaluation = rmodel.evaluate(test_ds, return_dict=True, verbose=0)

print(f"MSE: {evaluation['mse']}")
print(f"MAE: {evaluation['mae']}")
print(f"RMSE: {math.sqrt(evaluation['mse'])}")
MSE: 5.4397759437561035
MAE: 1.6559592485427856
RMSE: 2.3323327257825164
显示决策树
要使用 dtreeviz,我们需要将模型和训练数据捆绑在一起。我们还必须从随机森林中选择一个特定的树来显示;让我们选择树 3,就像我们在分类中所做的那样。
abalone_features = [f.name for f in rmodel.make_inspector().features()]
viz_rmodel = dtreeviz.model(rmodel, tree_index=3,
                           X_train=df_train_abalone[abalone_features],
                           y_train=df_train_abalone[abalone_label],
                           feature_names=abalone_features,
                           target_name='Rings')
函数 view() 显示了树的结构,但现在决策节点是散点图,而不是堆叠条形图。每个决策节点都显示了所指示变量与目标 (Rings) 的边际图。
viz_rmodel.view(scale=1.2)
与分类一样,回归从树的根节点开始,一直到特定的叶节点,最终对特定测试实例做出预测。通往叶节点的节点测试数值或分类变量,将回归器引导到特征空间的特定区域,该区域(希望)具有非常相似的目标值。
叶节点是条形图,显示了叶节点中所有实例的目标变量 Rings 值。水平参数没有意义,只是一些噪声,用于分离点,以便我们可以看到密度所在的位置。考虑左下角的叶节点,其中 n=10,Rings=3.30。这表明该叶节点中 10 个实例的平均 Rings 值为 3.30,这将是决策树对到达该叶节点的任何测试实例的预测。
让我们放大根节点,看看回归器如何根据变量 ShellWeight 进行分割。
viz_rmodel.view(depth_range_to_display=[0,0], scale=2)
对于 ShellWeight<0.164 的测试实例,回归器向下遍历根节点的左子节点;否则,它向下遍历右子节点。水平虚线表示与 ShellWeight 高于或低于 0.164 的实例相关的平均 Rings 值。
另一方面,用于分类变量的决策节点测试类别子集,因为类别是无序的。在树的第四层,有两个决策节点测试分类变量 Type。
viz_rmodel.view(depth_range_to_display=[3,3], scale=1.5)
测试类别的回归器节点使用颜色来指示子集。例如,第四层左侧的决策节点将回归器引导到左侧,如果测试实例具有 Type=I 或 Type=F;否则,回归器向下遍历右侧。黄色和蓝色表示与左右分支相关的两个类别值子集。水平虚线表示具有相关类别值(s)的实例的平均 Rings 目标值。
要显示大型树,可以使用 orientation 参数获取树的从左到右版本,尽管它相当高,因此使用 scale 来缩小它是一个好主意。使用机器上的屏幕放大功能,可以放大感兴趣的区域。
viz_rmodel.view(orientation='LR', scale=.5)
我们可以使用非花哨的绘图节省空间。它仍然显示决策节点的分割变量和分割点;只是没有那么漂亮。
viz_rmodel.view(fancy=False, scale=.75)
检查叶节点统计信息
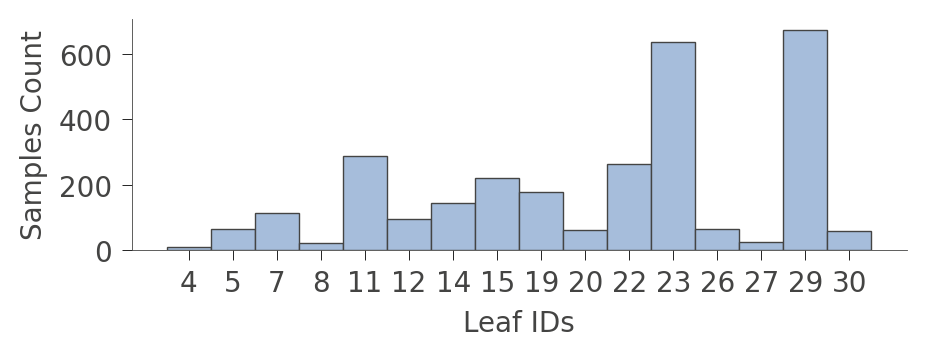
当图形变得非常大时,有时最好关注叶子。函数 leaf_sizes() 指示在每个叶中找到的实例数量。
viz_rmodel.leaf_sizes(figsize=(5,1.5))
我们还可以查看叶中实例的分布(Rings 值)。垂直轴为每个叶有一个“行”,水平轴显示每个叶中实例的 Rings 值的分布。最右侧的列显示每个叶的平均目标值。
viz_rmodel.rtree_leaf_distributions(figsize=(5,5))
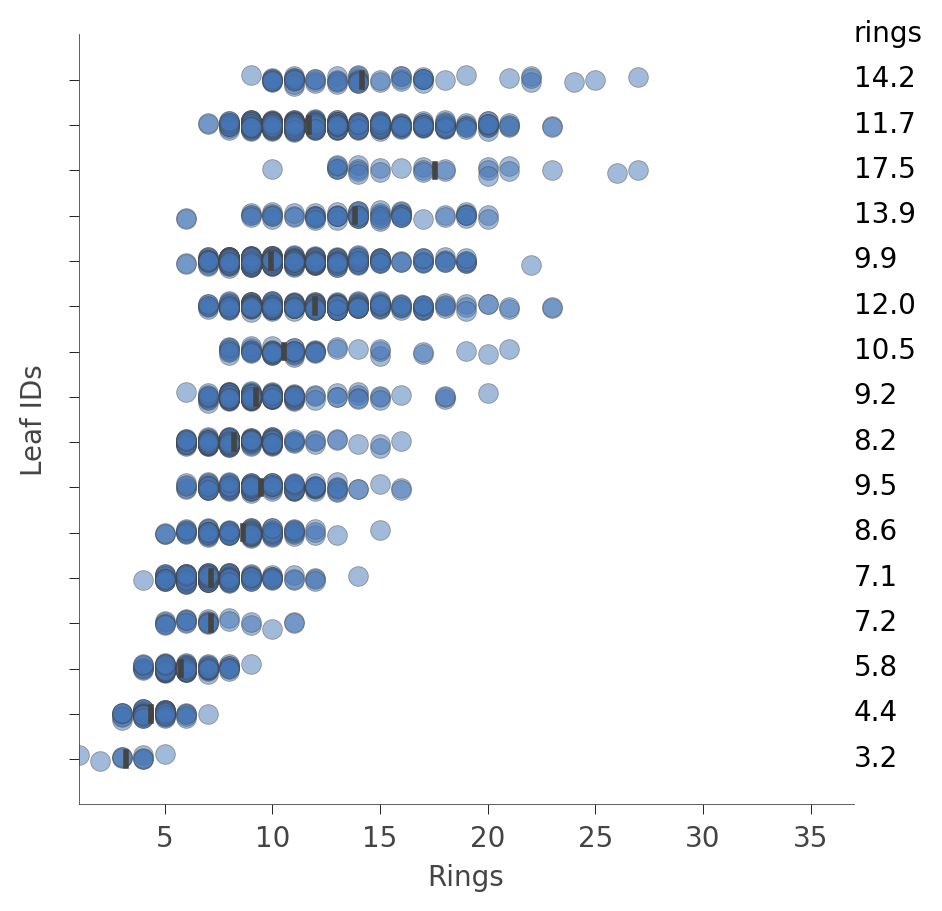
或者,我们可以获取有关特定节点中实例特征的信息。例如,以下是如何获取有关叶 ID 29 中特征的信息,该叶具有最多的实例。
viz_rmodel.node_stats(node_id=29)
决策树如何预测实例的值
要对特定实例进行预测,决策树会根据测试实例中的特征值从根部向下遍历到特定的叶。单个树的预测只是来自该叶中(来自训练集)的实例的 Rings 值的平均值。如果我们通过参数 x 提供测试实例,dtreeviz 库可以说明此过程。
x = df_abalone[abalone_features].iloc[1234]
viz_rmodel.view(x=x, scale=.75)
/tmpfs/src/tf_docs_env/lib/python3.9/site-packages/dtreeviz/models/shadow_decision_tree.py:335: FutureWarning: Series.__getitem__ treating keys as positions is deprecated. In a future version, integer keys will always be treated as labels (consistent with DataFrame behavior). To access a value by position, use `ser.iloc[pos]`
/tmpfs/src/tf_docs_env/lib/python3.9/site-packages/dtreeviz/trees.py:1351: FutureWarning: Series.__getitem__ treating keys as positions is deprecated. In a future version, integer keys will always be treated as labels (consistent with DataFrame behavior). To access a value by position, use `ser.iloc[pos]`
/tmpfs/src/tf_docs_env/lib/python3.9/site-packages/dtreeviz/trees.py:1356: FutureWarning: Series.__getitem__ treating keys as positions is deprecated. In a future version, integer keys will always be treated as labels (consistent with DataFrame behavior). To access a value by position, use `ser.iloc[pos]`
/tmpfs/src/tf_docs_env/lib/python3.9/site-packages/dtreeviz/trees.py:1324: FutureWarning: Series.__getitem__ treating keys as positions is deprecated. In a future version, integer keys will always be treated as labels (consistent with DataFrame behavior). To access a value by position, use `ser.iloc[pos]`
如果该可视化太大,我们可以将绘图缩减为仅从根到实际遍历的叶的路径。
viz_rmodel.view(x=x, show_just_path=True, scale=1.0)
/tmpfs/src/tf_docs_env/lib/python3.9/site-packages/dtreeviz/models/shadow_decision_tree.py:335: FutureWarning: Series.__getitem__ treating keys as positions is deprecated. In a future version, integer keys will always be treated as labels (consistent with DataFrame behavior). To access a value by position, use `ser.iloc[pos]`
/tmpfs/src/tf_docs_env/lib/python3.9/site-packages/dtreeviz/trees.py:1351: FutureWarning: Series.__getitem__ treating keys as positions is deprecated. In a future version, integer keys will always be treated as labels (consistent with DataFrame behavior). To access a value by position, use `ser.iloc[pos]`
/tmpfs/src/tf_docs_env/lib/python3.9/site-packages/dtreeviz/trees.py:1356: FutureWarning: Series.__getitem__ treating keys as positions is deprecated. In a future version, integer keys will always be treated as labels (consistent with DataFrame behavior). To access a value by position, use `ser.iloc[pos]`
/tmpfs/src/tf_docs_env/lib/python3.9/site-packages/dtreeviz/trees.py:1324: FutureWarning: Series.__getitem__ treating keys as positions is deprecated. In a future version, integer keys will always be treated as labels (consistent with DataFrame behavior). To access a value by position, use `ser.iloc[pos]`
我们可以使用水平方向使其更小。
viz_rmodel.view(x=x, show_just_path=True, scale=.75, orientation="LR")
/tmpfs/src/tf_docs_env/lib/python3.9/site-packages/dtreeviz/models/shadow_decision_tree.py:335: FutureWarning: Series.__getitem__ treating keys as positions is deprecated. In a future version, integer keys will always be treated as labels (consistent with DataFrame behavior). To access a value by position, use `ser.iloc[pos]`
/tmpfs/src/tf_docs_env/lib/python3.9/site-packages/dtreeviz/trees.py:1351: FutureWarning: Series.__getitem__ treating keys as positions is deprecated. In a future version, integer keys will always be treated as labels (consistent with DataFrame behavior). To access a value by position, use `ser.iloc[pos]`
/tmpfs/src/tf_docs_env/lib/python3.9/site-packages/dtreeviz/trees.py:1356: FutureWarning: Series.__getitem__ treating keys as positions is deprecated. In a future version, integer keys will always be treated as labels (consistent with DataFrame behavior). To access a value by position, use `ser.iloc[pos]`
/tmpfs/src/tf_docs_env/lib/python3.9/site-packages/dtreeviz/trees.py:1324: FutureWarning: Series.__getitem__ treating keys as positions is deprecated. In a future version, integer keys will always be treated as labels (consistent with DataFrame behavior). To access a value by position, use `ser.iloc[pos]`
有时,仅仅获得模型如何测试我们的特征值以做出决策的英文描述更容易。
print(viz_rmodel.explain_prediction_path(x=x))
0.25 <= Diameter
ShellWeight < 0.11
Type not in {'M', 'F'}
/tmpfs/src/tf_docs_env/lib/python3.9/site-packages/dtreeviz/models/shadow_decision_tree.py:335: FutureWarning: Series.__getitem__ treating keys as positions is deprecated. In a future version, integer keys will always be treated as labels (consistent with DataFrame behavior). To access a value by position, use `ser.iloc[pos]`
/tmpfs/src/tf_docs_env/lib/python3.9/site-packages/dtreeviz/interpretation.py:54: FutureWarning: Series.__getitem__ treating keys as positions is deprecated. In a future version, integer keys will always be treated as labels (consistent with DataFrame behavior). To access a value by position, use `ser.iloc[pos]`
特征空间划分
使用 rtree_feature_space(),我们可以看到决策树如何通过一系列分割来划分特征空间。例如,以下是决策树如何划分特征 ShellWeight。
viz_rmodel.rtree_feature_space(features=['ShellWeight'],
                              show={'splits'})
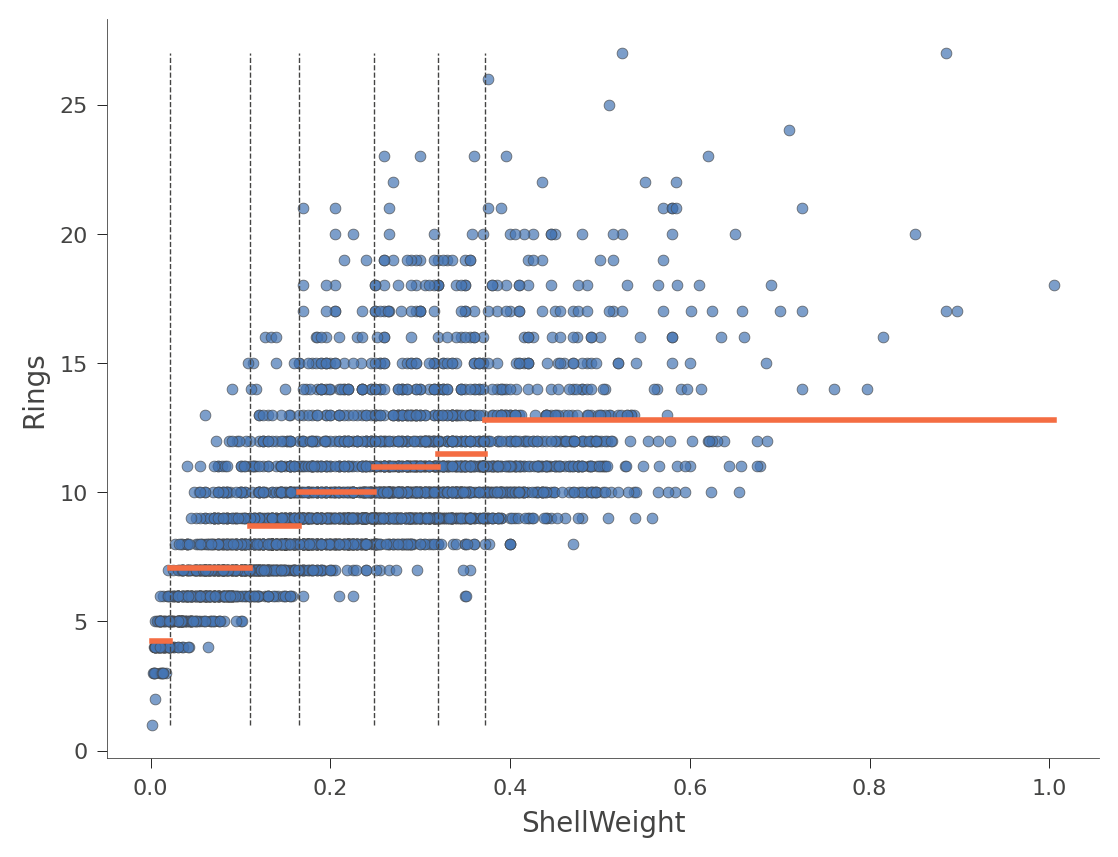
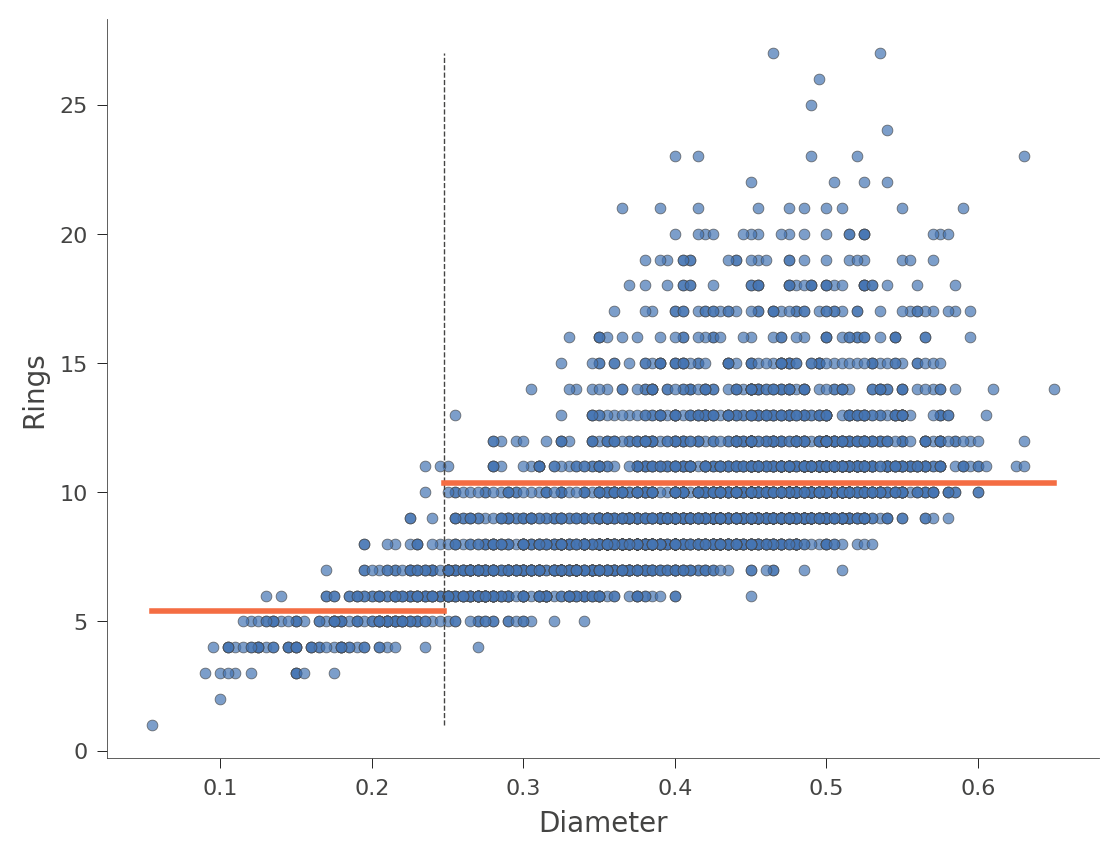
水平橙色条表示每个区域内的平均 Rings 值。以下是用特征 Diameter(树中只有一个分割)的另一个示例。
viz_rmodel.rtree_feature_space(features=['Diameter'], show={'splits'})
我们还可以查看二维特征空间,其中 Rings 值的颜色从绿色(低)到蓝色(高)变化。
viz_rmodel.rtree_feature_space(features=['ShellWeight','LongestShell'], show={'splits'})
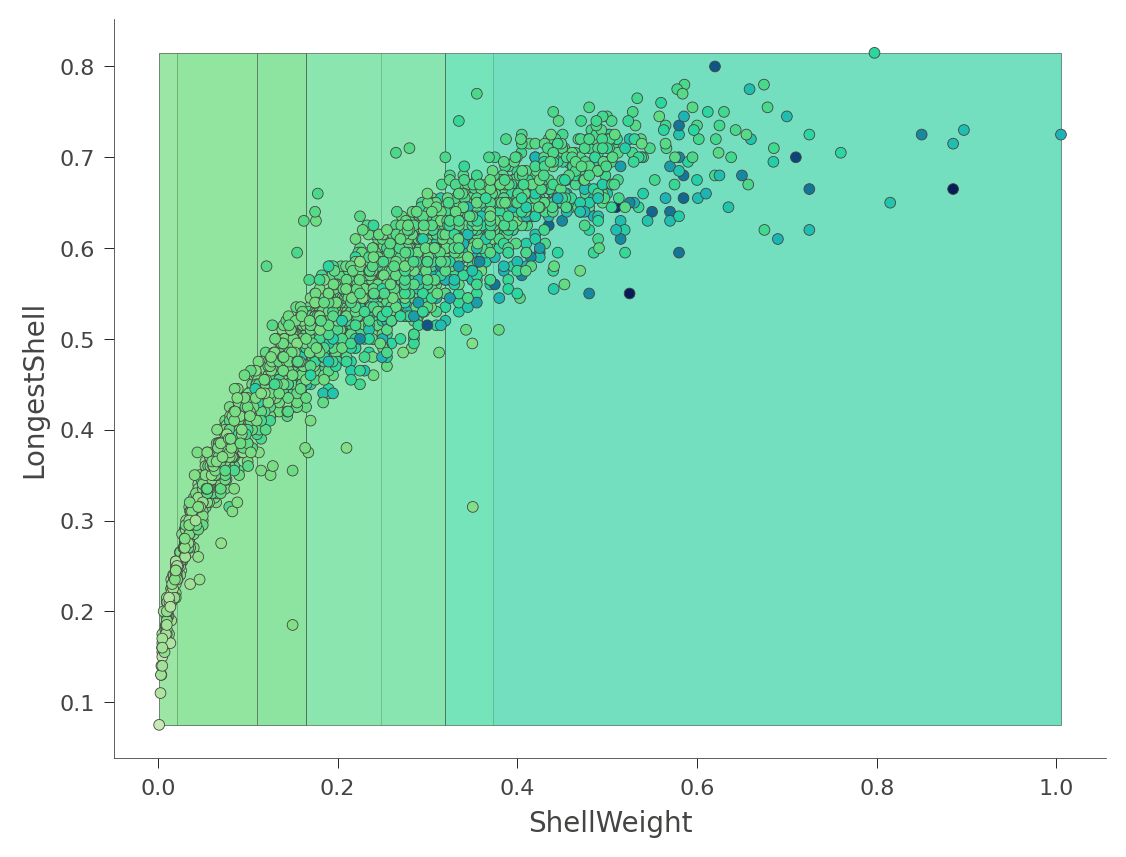
该热图可能令人困惑,因为它实际上是三维空间的二维投影:两个特征 x 目标值。相反,dtreeviz 可以从各种角度和高度向您展示这个三维图。
viz_rmodel.rtree_feature_space3D(features=['ShellWeight','LongestShell'],
                              show={'splits'}, elev=30, azim=140, dist=11, figsize=(9,8))
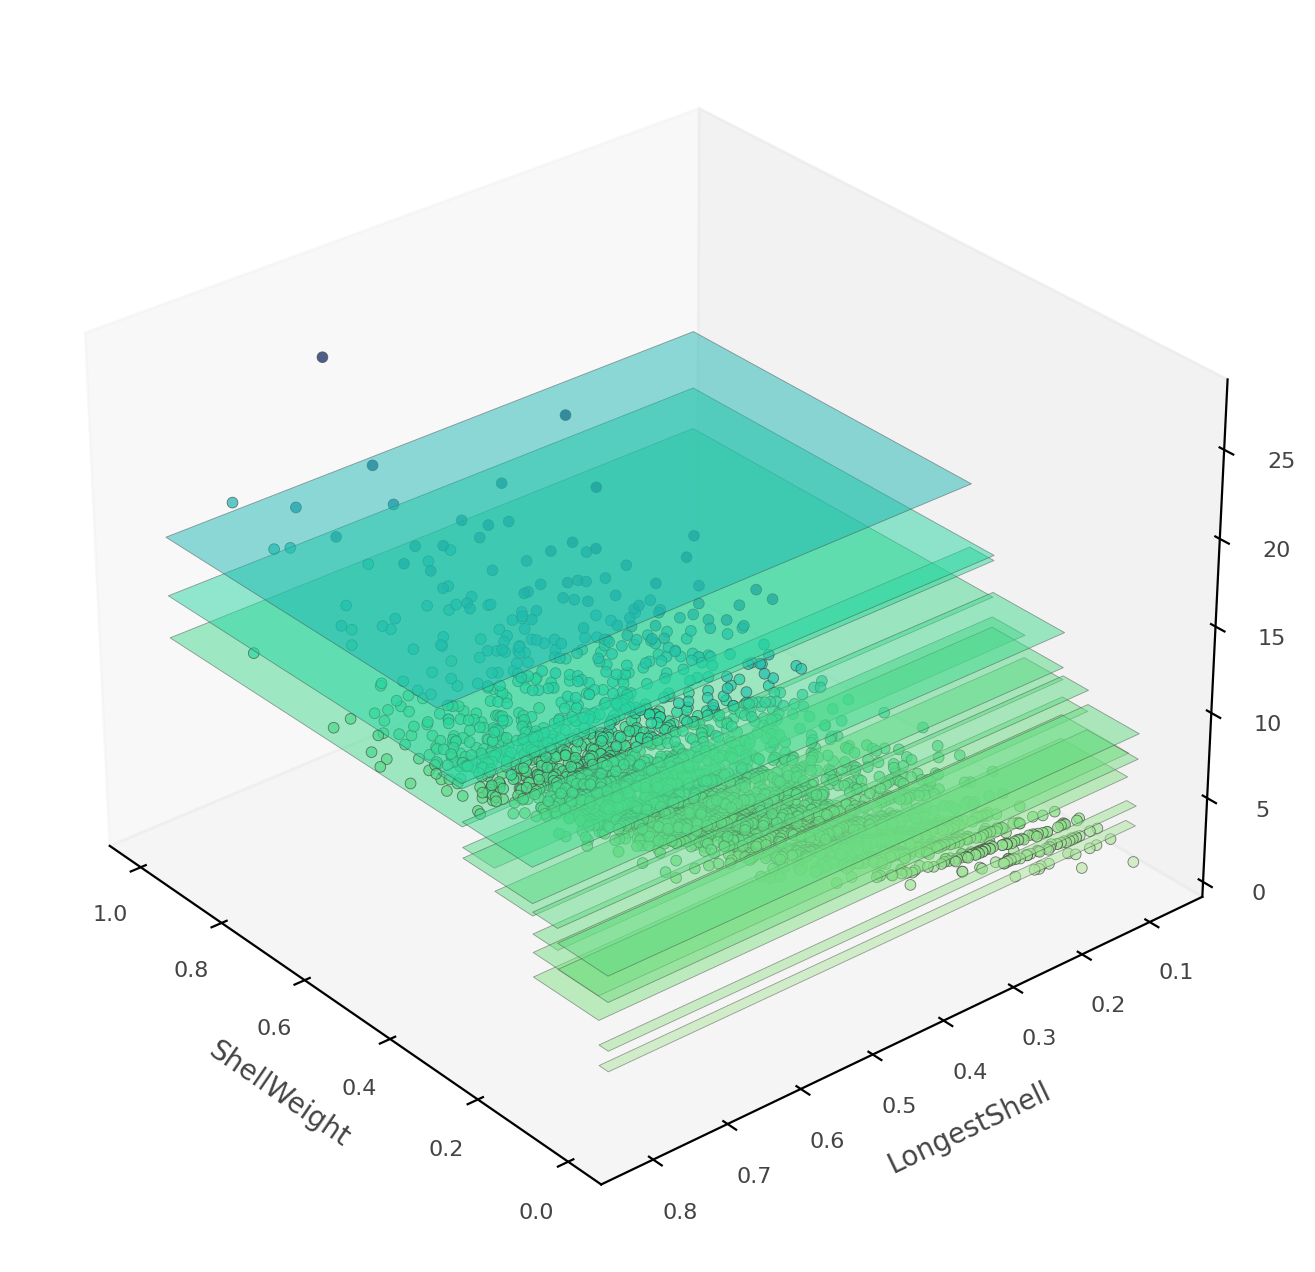
如果 ShellWeight 和 LongestShell 是模型测试的唯一特征,则不会有重叠的垂直“板”。特征空间的每个二维区域都会做出独特的预测。在这棵树中,还有其他特征可以区分模糊的垂直预测区域。
至此,您已经了解了如何使用 dtreeviz 来显示决策树的结构,绘制叶信息,跟踪模型如何解释特定实例以及模型如何划分未来空间。您已准备好使用自己的数据集来可视化和解释树!
